
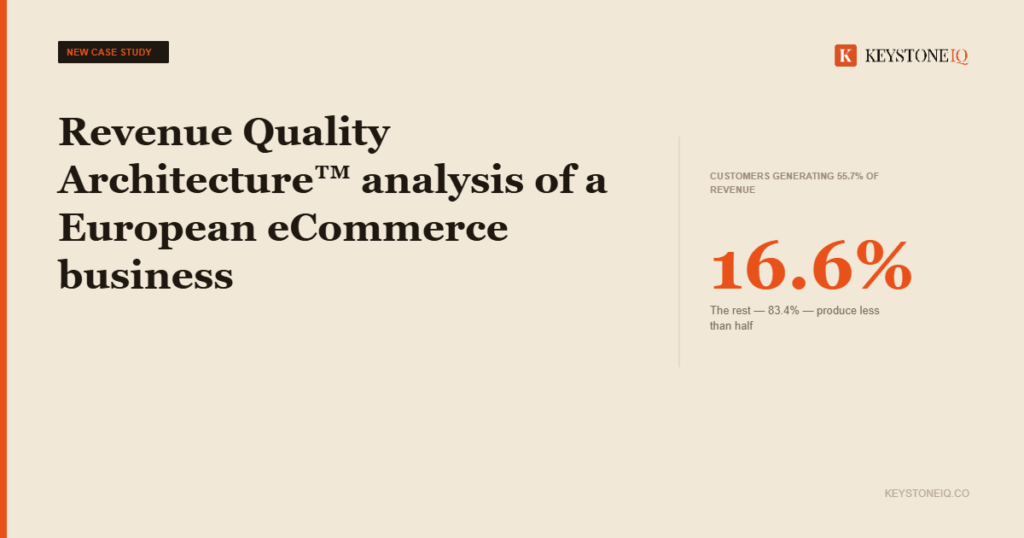
Standard commercial due diligence reads the P&L and asks whether revenue is growing. Customer behaviour analysis in private equity asks a different question: is the base underneath it durable, and what is it actually costing to hold the headline number together? Keystone IQ’s Revenue Quality Architecture™ is built on that question. A recent European ecommerce engagement shows what it surfaces that aggregate reporting cannot.
The problem with reading revenue from the top down
Most deal teams start with the revenue line and work outward. Revenue is growing. Customers are growing. Churn is low. The equity story holds together.
The difficulty is that these are aggregate metrics. They describe the net position of the business at a point in time. They do not describe the composition of that position, how it is being held together, or whether the customer behaviour sustaining it is improving or quietly deteriorating. Customer behaviour analysis in a private equity context is designed to answer exactly that: not what the revenue line says, but what the customer base underneath it is doing, and whether the two are telling the same story.
The Revenue Quality Architecture™ is designed to close that gap. It reads the same data the P&L is built from, but reconstructs it at individual customer level to show what is actually driving the number, where it is concentrated, and how durable it is.
What this looks like in practice: a European ecommerce case study
The following findings are drawn from a real engagement with a European ecommerce business. The client’s identity is withheld. All data is anonymised.
Every headline metric was positive. Our Revenue Quality Architecture™ produced a materially different picture – one that did not appear in the equity story.
- €1,196.8m: Revenue the existing base can sustain on its own
- €720.6m: Annual replacement dependency to hold the €1.92bn headline
- +€123.5m: Recoverable value from the existing base, no extra volume assumed
The concentration picture: 16.6% of customers generating 55.7% of revenue. Not visible in the headline customer count.
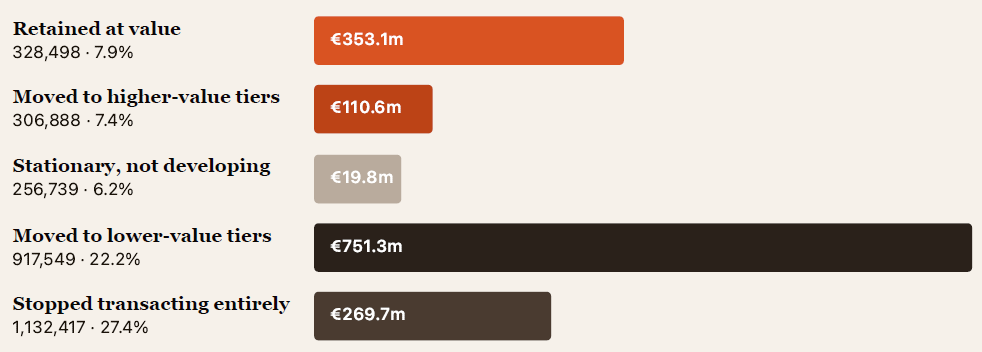
The churn picture: reported churn was 6.2%. Weighted by the revenue each customer carried, effective churn was 14.1%. A 7.9-point gap at value, invisible in standard analysis.
The replacement picture: €720.6m in annual volume required just to stand still. Four changes to retention and intake mix, none requiring more customer volume, lift the floor by €123.5m.
What the architecture also surfaced: €123.5m already in the base
The revenue floor of €1,196.8m is not the destination. The movement data also identifies the levers available to improve it, without requiring higher customer volume or additional acquisition spend.
Four interventions, each drawn from observed movement patterns in the existing base, lift the floor to €1,320.3m, unlocking €123.5m from customers the business already has.
Even with all four levers applied at realistic intensity, a significant portion of the €720.6m replacement dependency remains structural. That is itself a diligence finding. It describes exactly how hard the acquisition and reactivation engine has to work, every year, just to hold the reported number in place.
How the Revenue Quality Architecture™ works
The starting point is transaction-level data, no personally identifiable information is required. We rebuild the base from observed behaviour at individual customer level, using the underlying dimensions that actually create and sustain value in that business. Those dimensions are calibrated to the structure of the base itself, so the picture reflects the real mechanics of customer value, not a generic model applied on top of it.
The methodology does not stop at classification. It tracks established behaviour patterns over time, making movement and trajectory visible early: which customer types are stable, which are strengthening, which are beginning to weaken, and where value is migrating into less resilient parts of the base before that deterioration is visible in the headline numbers.
Step one: find the structure that exists in the data
Most segmentation approaches impose a structure: pre-set cohorts, RFM bins, lifecycle stages defined before the data is read. Keystone IQ’s customer behaviour analysis in private equity does the opposite. It identifies the natural clustering. The segment boundaries emerge from where customers actually cluster in the distributional analysis. They are not imposed. This matters because every customer base is different, and the patterns that define high-value, mid-tier, and dormant behaviour vary by business model, category, and competitive context. A rigid template applied across all businesses averages out exactly the structural differences that make one customer base more durable than another.
Step two: track how customers move between those tiers
A static snapshot shows where revenue sits today. The movement layer shows what is happening underneath it over time: which customers are strengthening, which are stepping down, which have gone inactive, and crucially, what revenue is travelling with them. This is the layer that aggregate reporting cannot surface. A business where revenue is stable but the top tier is quietly losing customers to the mid-tier, while the mid-tier feeds the dormant pool, looks healthy on a blended metric and is structurally deteriorating. The movement data resolves that ambiguity.
Step three: apply operator judgement above the analytics
The analytical output is the starting point, not the conclusion. What makes Keystone IQ’s Revenue Quality Architecture™ operationally useful is the interpretive layer above the analysis: twenty years of experience inside customer bases across ecommerce, SaaS, subscription, streaming, loyalty, financial services, and retail.
That experience determines which patterns matter for this specific business and this specific investment thesis. The data finds patterns in every dataset. The operator judgement layer determines which patterns carry deal significance, which are structural and which are cyclical, and what the management team should prioritise in the first hundred days if they want to move the numbers that actually support the multiple.
Analytics is increasingly commoditised. AI systems can run cohort models and segment customers at scale. The judgement of which patterns matter, in which deal context, connected to which operational lever, is the layer that cannot be replicated by a model. It requires having been wrong, learning, and recalibrating across two decades of real customer bases.
Why this matters at entry, hold, and exit
The three numbers that emerged from this engagement are relevant at every stage of the deal. They are not a one-time diligence output. They are a baseline against which the hold period can be managed and the exit story evidenced.
| At entry Shows what is actually being bought: the concentration, the floor, the replacement dependency, before capital is committed. The customer base is the asset. Know what it can sustain before you price it. | During hold Becomes the operating intelligence behind the value creation agenda. Specific, measurable customer movement objectives, tracked year on year against the same data. Not a strategy document. A baseline with a direction. | At exit Builds the equity story on evidence rather than projection. How the base moved, which segments strengthened, whether the replacement dependency improved. The buyer’s DD team will ask these questions. The answer should already exist. |
The full case study
The full anonymised case study, including the complete customer base structure, the movement matrix, and the scenario analysis, is available to download. It is the most direct illustration of what the Revenue Quality Architecture™ produces and how it applies to a real deal context.
Read the full ecommerce customer base analysis on the case study page.