
Keystone IQ, an operator-grade customer-base intelligence firm for private equity deal teams, launches today with evidence, not a promise: an anonymised Revenue Quality Architecture™ analysis of a real customer base, and the implications for three key deal moments: entry, hold and exit.
Revenue quality architecture for deals where customer behaviour drives value
The most valuable asset in most private capital deals is the least understood
Customer bases generate the revenue that justifies enterprise value. Yet standard due diligence processes treat them as a static input, a revenue line to be extrapolated, a churn rate to be benchmarked, a set of cohorts to be graphed. None of that tells you whether the customers who are generating today’s revenue will still be there in eighteen months. Or whether the composition of the base is improving, deteriorating, or masking movement in both directions simultaneously.
Same data, two different stories
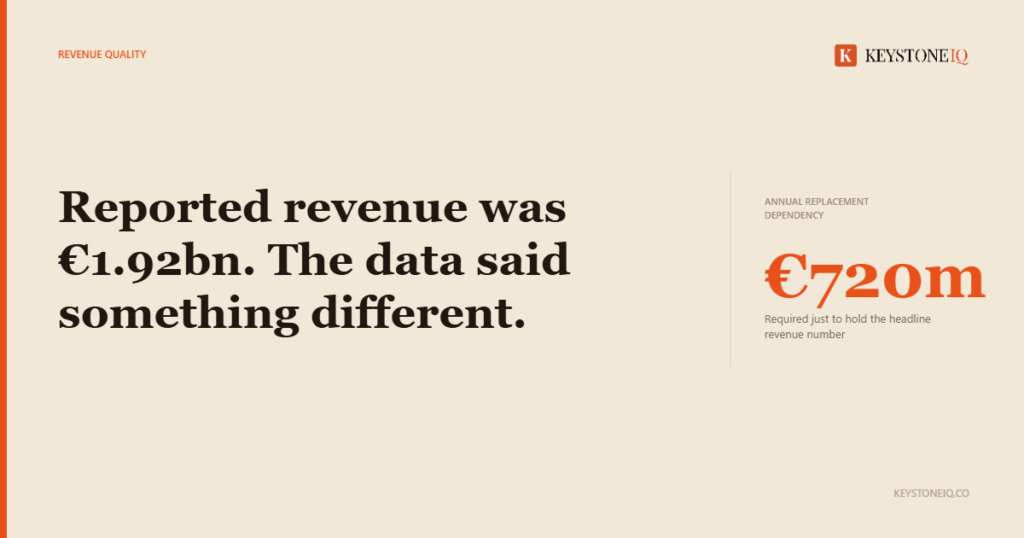
The business in our launch case study looks healthy on every headline metric. €1.92bn in revenue. Customers up 32% year on year. We rebuilt the base from transaction-level behaviour, scored every customer using Keystone IQ’s Revenue Quality Architecture™ and tracked year on year. Three numbers emerged that do not appear in the equity story.
- €1,196.8m – The revenue the existing base can sustain on its own
- €720.6m – Annual replacement dependency to hold the €1.92bn headline
- +€123.5m – Recoverable value already inside the base
The reported number was real but the dependency holding it up was not visible in the P&L.
The concentration story
16.6% of customers generated 55.7% of revenue. The broader high-value band, also a minority of customers, carried most of the rest. That concentration was not visible in the headline customer count. But it is visible in the movement data and it changes how you look at the revenue the headline is really resting on.
The churn story
Reported churn was 6.2% but when you weighted customers by the revenue they carried, effective churn rose to 14.1%. Standard analysis anchored on the reported churn rate missed a 7.9-point gap at value. That gap widens the difference between apparent and actual revenue durability over a multi-year horizon, and it does not appear in the P&L.
The replacement story
The business reported €1.92bn revenue. On observed movement rates, the existing customer base could only sustain €1,196.8m. The €720.6m difference is the annual acquisition and reactivation volume required just to stand still. We identified four changes to retention and intake mix, none requiring more customer volume, that lift the floor to €1,320.3m and unlock €123.5m from the base that already exists.
The blind spot in standard private equity deal due diligence
Conventional commercial due diligence assesses the market, its size, growth and competitive position. Cohort summaries, blended churn, CAC, LTV and modelled assumptions describe the base in aggregate, and aggregates are exactly what hide concentration and movement risk.
Why understanding revenue quality is critical to private equity value
Revenue growth is now the dominant driver of private equity value creation, contributing between 56% and 70% of enterprise value uplift by quartile as multiple expansion fades. That growth is only as durable as the customers producing it. At exit the evidence gap is just as sharp: 41% of firms say they lack the data granularity to support their equity story, and 65% struggle to capture value creation in exit EBITDA. The customer base is where that evidence lives.
What makes Keystone IQ different
We are operators, not just analysts. Natalie McCrae spent twenty years inside ecommerce, subscription, loyalty, retail and financial services customer bases, using behaviour to run the P&L, not just explain it. Keystone IQ’s Revenue Quality Architecture™ adds the layer above the analytics: operator judgement. The segmentation is not a formula or a template dropped onto the data. It reads the natural breaks in each base, then interprets what the movement between tiers means for the deal.
A snapshot shows the structure on one day. The movement layer shows where customers actually went. In the launch case, more than three times as many customers moved down as up, and nearly seven times as much value flowed down as up. The reported revenue held because acquisition filled the gap. The base underneath was deteriorating.
How Keystone IQ helps PE deal teams
At Entry
Keystone IQ delivers this through two engagements. Both fit live deal processes and both require only anonymised transaction data, with no PII. The Health Check is a five-day behavioural read on customer-base health, built for screening: it shows where the revenue is concentrated, how resilient the base is, and whether recent growth is arriving at high or low value, before a deal team commits to the larger budget that formal due diligence requires.
Through Hold and at Exit
The Customer Base Diagnostic goes deeper, a year-on-year analysis of how customers move across the full base with twelve-month forward scenarios, delivered in around ten days. It is built for the hold, where it surfaces compositional risk before it reaches the revenue line, and for exit, where it produces the customer evidence layer that makes the equity story defensible in the data room.
Download the full case study →
Keystone IQ is open for conversations with deal teams and operating partners from today.